# Status in Pods
## Pod in ContainerCreating Status
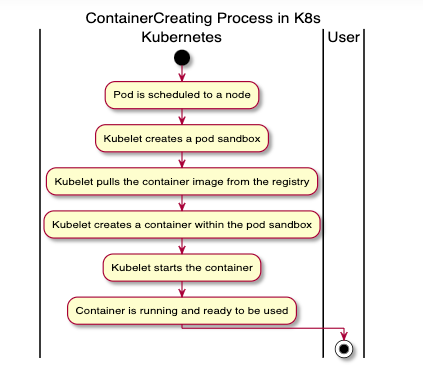
In K8s, when a pod status shows “ContainerCreating”, it means that the pod has been scheduled on a node (the decision has been made regarding which node the pod should run on), and the `kubelet` on that node is in the process of creating the containers for that pod.
During this phase, the following actions are performed:
1. Pulling the required Docker images onto the node (if they are not already available locally).
2. Creating the containers from these images.
3. Starting the containers.
If everything goes as expected, the pod status transitions from “ContainerCreating” to “Running” once all of the containers within the pod are up and running.
Container creating process
## Common Causes
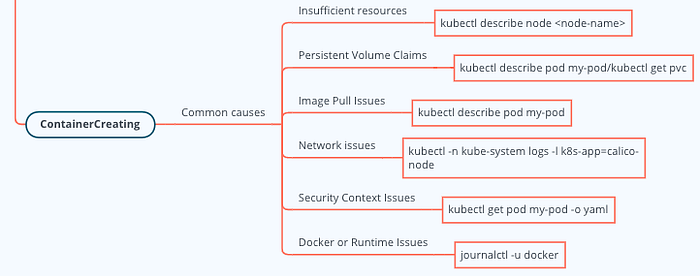
If a pod is stuck in ContainerCreating status for a long time, it generally indicates that there’s an issue preventing the containers from being successfully created. Some of the common reasons include:
1. **Image Pull Issues**: This is one of the most common issues. It could be that the specified image doesn’t exist, the image name is misspelled, or there’s a network issue preventing the image from being pulled.
2. **Insufficient Resources**: If the node doesn’t have enough CPU or memory resources available to run the containers, then the pod will not be able to move past the “ContainerCreating” status.
3. **Network Issues**: If there’s a network issue, such as a problem with the CNI (Container Network Interface) plugin, it might prevent the containers from being created.
4. **Security Context Issues**: If the security context for the pod or container is not properly configured (for example, the pod is trying to run as a specific user that doesn’t exist), it can prevent the container from starting.
5. **Docker or Runtime Issues**: If there are issues with the Docker daemon or container runtime, it could prevent the containers from being created.
6. **Issues with Persistent Volumes**: If the pod is dependent on a Persistent Volume Claim (PVC) and that PVC is not available or can’t be mounted for some reason, the pod will remain in the “ContainerCreating” state.
## How to Troubleshoot
### Image Pull Issues
You can use the `kubectl describe pod ` command to check the events of the pod.
```sh
kubectl describe pod my-pod
```
Look for “Failed to pull image” or “ImagePullBackOff” events. These indicate issues with pulling the container image. If you see authentication errors, check your imagePullSecrets and registry credentials.
**Real-life example:**
```sh
kubectl describe pod my-pod | grep -A5 Events
# Look for lines like:
# Failed to pull image "myrepo/myimage:tag": rpc error: ...
```
### Insufficient Resources
Use the `kubectl describe node ` command to check the resources on your node.
```sh
kubectl describe node my-node
```
Check the Allocatable and Capacity sections, and look for events about resource pressure (e.g., OutOfcpu, OutOfmemory).
**Real-life example:**
```sh
kubectl get pods -o wide
kubectl describe node | grep -i allocatable -A5
```
### Issues with Persistent Volumes
You can check Pod status using `kubectl`:
```sh
kubectl describe pod my-pod
```
Look for errors like:
```sh
Kubelet(k8s-node2) Error syncing pod, skipping: timeout expired waiting
for volumes to attach/mount for pod "my-pod"/"default".
list of unattached/unmounted volumes=[ceph-pv]
```
Then check the PVC status:
```sh
kubectl get pvc
```
If the STATUS of a PVC is not “Bound”, there might be issues with storage provisioning. For cloud providers, check your storage class and cloud disk quotas.
**Real-life example:**
```sh
kubectl get pvc -A
kubectl describe pvc
```
### Network Issues
Network issues can be a bit harder to diagnose. You can check the logs of your CNI plugin (which depends on the specific CNI you are using). For example, if you’re using Calico, you can check the logs of the Calico pods:
```sh
kubectl -n kube-system logs -l k8s-app=calico-node
```
For AWS EKS, Azure AKS, or GCP GKE, check the cloud provider’s CNI documentation and ensure your VPC/subnet/network policies allow pod networking.
### Security Context Issues
Check the security context of your Pod using the `kubectl get pod -o yaml` command.
```sh
kubectl get pod my-pod -o yaml
```
Look for fields like `runAsUser`, `fsGroup`, or `privileged`. Ensure the user/group exists in the container image and that the node allows the requested privileges.
### Docker or Runtime Issues
Check the logs on your node. The way to do this depends on your node’s operating system and your container runtime. For Docker on a system using `systemd`, you can use:
```sh
journalctl -u docker
```
For containerd:
```sh
journalctl -u containerd
```
On managed Kubernetes (EKS, AKS, GKE), use the cloud provider’s node troubleshooting tools or review logs in the cloud console.
***
## Additional Troubleshooting Tips
* Use `kubectl get events --sort-by=.metadata.creationTimestamp` to see recent cluster events.
* Use `kubectl logs -c ` to check init container logs if present.
* For multi-cloud: Check IAM roles, disk quotas, and network security groups in AWS, Azure, or GCP.
* Use [kubectl-debug](https://github.com/aylei/kubectl-debug) or [stern](https://github.com/stern/stern) for advanced debugging.
***
## References
* [Kubernetes Pod Lifecycle](https://kubernetes.io/docs/concepts/workloads/pods/pod-lifecycle/)
* [Kubernetes Troubleshooting Pods](https://kubernetes.io/docs/tasks/debug/debug-application/debug-pod-replication-controller/)
* [AWS EKS Troubleshooting](https://docs.aws.amazon.com/eks/latest/userguide/troubleshooting.html)
* [Azure AKS Troubleshooting](https://learn.microsoft.com/en-us/azure/aks/troubleshooting/)
* [GCP GKE Troubleshooting](https://cloud.google.com/kubernetes-engine/docs/troubleshooting)
> **Tip:** Always check `kubectl describe pod`, node status, PVCs, and CNI logs. For cloud clusters, use provider-specific troubleshooting docs and dashboards.
## Conclusion
[ ](https://medium.com/tag/kubernetes?source=post_page-----e89e093d996e---------------kubernetes-----------------)
---
# Agent Instructions: Querying This Documentation
If you need additional information that is not directly available in this page, you can query the documentation dynamically by asking a question.
Perform an HTTP GET request on the current page URL with the `ask` query parameter:
```
GET https://freundcloud.gitbook.io/devops-examples-from-real-life/containers-and-orchestration/containers/kubernetes/tips/k8s-troubleshooting-pod-in-container-creating-status.md?ask=
```
The question should be specific, self-contained, and written in natural language.
The response will contain a direct answer to the question and relevant excerpts and sources from the documentation.
Use this mechanism when the answer is not explicitly present in the current page, you need clarification or additional context, or you want to retrieve related documentation sections.