DevOps help for Cloud Platform Engineers
  • Welcome!
  • Quick Start Guide
  • About Me
  • CV
  • Contribute
  • 🧠DevOps & SRE Foundations
    • DevOps Overview
      • Engineering Fundamentals
      • Implementing DevOps Strategy
      • DevOps Readiness Assessment
      • Lifecycle Management
      • The 12 Factor App
      • Design for Self Healing
      • Incident Management Best Practices (2025)
    • SRE Fundamentals
      • Toil Reduction
      • System Simplicity
      • Real-world Scenarios
        • AWS VM Log Monitoring API
    • Agile Development
      • Team Agreements
        • Definition of Done
        • Definition of Ready
        • Team Manifesto
        • Working Agreement
    • Industry Scenarios
      • Finance and Banking
      • Public Sector (UK/EU)
      • Energy Sector Edge Computing
  • DevOps Practices
    • Platform Engineering
    • FinOps
    • Observability
      • Modern Practices
  • 🚀Modern DevOps Practices
    • Infrastructure Testing
    • Modern Development
    • Database DevOps
  • 🛠️Infrastructure as Code (IaC)
    • Terraform
      • Cloud Integrations - Provider-specific implementations
        • Azure Scenarios
          • Azure Authetication
            • Service Principal
            • Service Principal in block
            • Service Principal in env
        • AWS Scenarios
          • AWS Authentication
        • GCP Scenarios
          • GCP Authentication
      • Testing and Validation
        • Unit Testing
        • Integration Testing
        • End-to-End Testing
        • Terratest Guide
      • Best Practices
        • State Management
        • Security
        • Code Organization
        • Performance
      • Tools & Utilities - Enhancing the Terraform workflow
        • Terraform Docs
        • TFLint
        • Checkov
        • Terrascan
      • CI/CD Integration - Automating infrastructure deployment
        • GitHub Actions
        • Azure Pipelines
        • GitLab CI
    • Bicep
      • Getting Started - First steps with Bicep [BEGINNER]
      • Template Specs
      • Best Practices - Guidelines for effective Bicep implementations
      • Modules - Building reusable components [INTERMEDIATE]
      • Examples - Sample implementations for common scenarios
      • Advanced Features
      • CI/CD Integration - Automating Bicep deployments
        • GitHub Actions
        • Azure Pipelines
  • 💰Cost Management & FinOps
    • Cloud Cost Optimization
  • 🐳Containers & Orchestration
    • Containerization Overview
      • Docker
        • Dockerfile Best Practices
        • Docker Compose
      • Kubernetes
        • CLI Tools - Essential command-line utilities
          • Kubectl
          • Kubens
          • Kubectx
        • Core Concepts
        • Components
        • Best Practices
          • Pod Security
          • Security Monitoring
          • Resource Limits
        • Advanced Features - Beyond the basics [ADVANCED]
          • Service Mesh
            • Istio
            • Linkerd
          • Ingress Controllers
            • NGINX
            • Traefik
            • Kong
            • Gloo Edge
            • Contour
        • Tips
          • Status in Pods
          • Resource handling
          • Pod Troubleshooting Commands
        • Enterprise Architecture
        • Health Management
        • Security & Compliance
        • Virtual Clusters
      • OpenShift
  • Service Mesh & Networking
    • Service Mesh Implementation
  • Architecture Patterns
    • Data Mesh
    • Multi-Cloud Networking
    • Disaster Recovery
    • Chaos Engineering
  • Edge Computing
    • Implementation Guide
      • Serverless Edge
      • IoT Edge Patterns
      • Real-Time Processing
      • Edge AI/ML
      • Security Hardening
      • Observability Patterns
      • Network Optimization
      • Storage Patterns
  • 🔄CI/CD & GitOps
    • CI/CD Overview
      • Continuous Integration
      • Continuous Delivery
        • Deployment Strategies
        • Secrets Management
        • Blue-Green Deployments
        • Deployment Metrics
        • Progressive Delivery
        • Release Management for DevOps/SRE (2025)
      • CI/CD Platforms - Tool selection and implementation
        • Azure DevOps
          • Pipelines
            • Stages
            • Jobs
            • Steps
            • Templates - Reusable pipeline components
            • Extends
            • Service Connections - External service authentication
            • Best Practices for 2025
            • Agents and Runners
            • Third-Party Integrations
            • Azure DevOps CLI
          • Boards & Work Items
        • GitHub Actions
        • GitLab
          • GitLab Runner
          • Real-life scenarios
          • Installation guides
          • Pros and Cons
          • Comparison with alternatives
      • GitOps
        • Modern GitOps Practices
        • GitOps Patterns for Multi-Cloud (2025)
        • Flux
          • Overview
          • Progressive Delivery
          • Use GitOps with Flux, GitHub and AKS
  • Source Control
    • Source Control Overview
      • Git Branching Strategies
      • Component Versioning
      • Kubernetes Manifest Versioning
      • GitLab
      • Creating a Fork
      • Naming Branches
      • Pull Requests
      • Integrating LLMs into Source Control Workflows
  • ☁️Cloud Platforms
    • Cloud Strategy
      • AWS to Azure
      • Azure to AWS
      • GCP to Azure
      • AWS to GCP
      • GCP to AWS
    • Azure
      • Best Practices
        • Azure Best Practices Overview
        • Azure Architecture Best Practices
        • Azure Naming Standards
        • Azure Tags
        • Azure Security Best Practices
      • Landing Zones
      • Services
        • Azure Active Directory (AAD)
        • Azure Monitor
        • Azure Key Vault
        • Azure Service Bus
        • Azure DNS
        • Azure App Service
        • Azure Batch
        • Azure Machine Learning
        • Azure OpenAI Service
        • Azure Cognitive Services
        • Azure Kubernetes Service (AKS)
        • Azure Databricks
        • Azure SQL Database
      • Monitoring
      • Administration Tools - Platform management interfaces
        • Azure PowerShell
        • Azure CLI
      • Tips & Tricks
    • AWS
      • Authentication
      • Best Practices
      • Tips & Tricks
      • Services
        • AWS IAM (Identity and Access Management)
        • Amazon CloudWatch
        • Amazon SNS (Simple Notification Service)
        • Amazon SQS (Simple Queue Service)
        • Amazon Route 53
        • AWS Elastic Beanstalk
        • AWS Batch
        • Amazon SageMaker
        • Amazon Bedrock
        • Amazon Comprehend
    • Google Cloud
      • Services
        • Cloud CDN
        • Cloud DNS
        • Cloud Load Balancing
        • Google Kubernetes Engine (GKE)
        • Cloud Run
        • Artifact Registry
        • Compute Engine
        • Cloud Functions
        • App Engine
        • Cloud Storage
        • Persistent Disk
        • Filestore
        • Cloud SQL
        • Cloud Spanner
        • Firestore
        • Bigtable
        • BigQuery
        • VPC (Virtual Private Cloud)
  • 🔐Security & Compliance
    • DevSecOps Overview
      • DevSecOps Pipeline Security
      • DevSecOps
        • Real-life Examples
        • Scanning & Protection - Automated security tooling
          • Dependency Scanning
          • Credential Scanning
          • Container Security Scanning
          • Static Code Analysis
            • Best Practices
            • Tool Integration Guide
            • Pipeline Configuration
        • CI/CD Security
        • Secrets Rotation
      • Supply Chain Security
        • SLSA Framework
        • Binary Authorization
        • Artifact Signing
      • Security Best Practices
        • Threat Modeling
        • Kubernetes Security
      • SecOps
      • Zero Trust Model
      • Cloud Compliance
        • ISO/IEC 27001:2022
        • ISO 22301:2019
        • PCI DSS
        • CSA STAR
      • Security Frameworks
      • SIEM and SOAR
  • Security Architecture
    • Zero Trust Implementation
      • Identity Management
      • Network Security
      • Access Control
  • 🔍Observability & Monitoring
    • Observability Fundamentals
      • Logging
      • Metrics
      • Tracing
      • Dashboards
      • SLOs and SLAs
      • Observability as Code
      • Pipeline Observability
  • 🧪Testing Strategies
    • Testing Overview
      • Modern Testing Approaches
      • End-to-End Testing
      • Unit Testing
      • Performance Testing
        • Load Testing
      • Fault Injection Testing
      • Integration Testing
      • Smoke Testing
  • 🤖AI Integration
    • AIops Overview
      • Workflow Automation
      • Predictive Analytics
      • Code Quality
  • 🧠AI & LLM Integration
    • Overview
      • Claude
        • Installation Guide
        • Project Guides
        • MCP Server Setup
        • LLM Comparison
      • Ollama
        • Installation Guide
        • Configuration
        • Models and Fine-tuning
        • DevOps Usage
        • Docker Setup
        • GPU Setup
        • Open WebUI
      • Copilot
        • Installation Guide
        • VS Code Integration
        • CLI Usage
      • Gemini
        • Installation Guides - Platform-specific setup
          • Linux Installation
          • WSL Installation
          • NixOS Installation
        • Gemini 2.5 Features
        • Roles and Agents
        • NotebookML Guide
        • Cloud Infrastructure Deployment
        • Summary
  • 💻Development Environment
    • DevOps Tools
      • Operating Systems - Development platforms
        • NixOS
          • Install NixOS: PC, Mac, WSL
          • Nix Language Deep Dive
          • Nix Language Fundamentals
            • Nix Functions and Techniques
            • Building Packages with Nix
            • NixOS Configuration Patterns
            • Flakes: The Future of Nix
          • NixOS Generators: Azure & QEMU
        • WSL2
          • Distributions
          • Terminal Setup
      • Editor Environments
      • CLI Tools
        • Azure CLI
        • PowerShell
        • Linux Commands
          • SSH - Secure Shell)
            • SSH Config
            • SSH Port Forwarding
        • Linux Fundametals
        • Cloud init
          • Cloud init examples
        • YAML Tools
          • How to create a k8s yaml file - How to create YAML config
          • YQ the tool
  • 📚Programming Languages
    • Python
    • Go
    • JavaScript/TypeScript
    • Java
    • Rust
  • Platform Engineering
    • Implementation Guide
  • FinOps
    • Implementation Guide
  • AIOps
    • LLMOps Guide
  • Should Learn
    • Should Learn
    • Linux
      • Commands
      • OS
      • Services
    • Terraform
    • Getting Started - Installation and initial setup [BEGINNER]
    • Cloud Integrations
    • Testing and Validation - Ensuring infrastructure quality
      • Unit Testing
      • Integration Testing
      • End-to-End Testing
      • Terratest Guide
    • Best Practices - Production-ready implementation strategies
      • State Management
      • Security
      • Code Organization
      • Performance
    • Tools & Utilities
    • CI/CD Integration
    • Bicep
    • Kubernetes
      • kubectl
    • Ansible
    • Puppet
    • Java
    • Rust
    • Azure CLI
  • 📖Documentation Best Practices
    • Documentation Strategy
      • Project Documentation
      • Release Notes
      • Static Sites
      • Documentation Templates
      • Real-World Examples
  • 📋Reference Materials
    • Glossary
    • Tool Comparison
    • Tool Decision Guides
    • Recommended Reading
    • Troubleshooting Guide
    • Development Setup
Powered by GitBook
On this page
  • Why Performance Testing
  • Key Performance Testing categories
  • Cloud-Native Performance Testing
  • Modern Performance Testing Tools
  • Cloud-Native Monitoring Integration
  • Automated Performance Testing in CI/CD
  • Performance monitor metrics
  • Physical Disk
  • Processor
  • Network Adapter
  • Memory
  • Key Performance testing activities
Edit on GitHub
  1. Testing Strategies
  2. Testing Overview

Performance Testing

PreviousUnit TestingNextLoad Testing

Last updated 5 days ago

Performance Testing is an overloaded term that is used to refer to several subcategories of performance related testing, each of which has different purpose.

A good description of overall performance testing is as follows:

Performance testing is a type of testing intended to determine the responsiveness, throughput, reliability, and/or scalability of a system under a given workload. .

Before getting into the different subcategories of performance tests let us understand why performance testing is typically done.

Why Performance Testing

Performance testing is commonly conducted to accomplish one or more the following:

  • Tune the system's performance

    • Identifying bottlenecks and issues with the system at different load levels.

    • Comparing performance characteristics of the system for different system configurations.

    • Produce a scaling strategy for the system.

  • Assist in capacity planning

    • Capacity planning is the process of determining what type of hardware and software resources are required to run an application to support pre-defined performance goals.

    • Capacity planning involves identifying business expectations, the periodic fluctuations of application usage, considering the cost of running the hardware and software infrastructure.

  • Assess the system's readiness for release:

    • Evaluating the system's performance characteristics (response time, throughput) in a production-like environment. The goal is to ensure that performance goals can be achieved upon release.

  • Evaluate the performance impact of application changes

    • Comparing the performance characteristics of an application after a change to the values of performance characteristics during previous runs (or baseline values), can provide an indication of performance issues (performance regression) or enhancements introduced due to a change

Key Performance Testing categories

Performance testing is a broad topic. There are many areas where you can perform tests. In broad strokes you can perform tests on the backend and on the front end. You can test the performance of individual components as well as testing the end-to-end functionality.

There are several categories of tests as well:

Load Testing

This is the subcategory of performance testing that focuses on validating the performance characteristics of a system, when the system faces the load volumes which are expected during production operation. An Endurance Test or a Soak Test is a load test carried over a long duration ranging from several hours to days.

Stress Testing

This is the subcategory of performance testing that focuses on validating the performance characteristics of a system when the system faces extreme load. The goal is to evaluate how does the system handles being pressured to its limits, does it recover (i.e., scale-out) or does it just break and fail?

Endurance Testing

The goal of endurance testing is to make sure that the system can maintain good performance under extended periods of load.

Spike testing

The goal of Spike testing is to validate that a software system can respond well to large and sudden spikes.

Chaos testing

Chaos testing or Chaos engineering is the practice of experimenting on a system to build confidence that the system can withstand turbulent conditions in production. Its goal is to identify weaknesses before they manifest system wide. Developers often implement fallback procedures for service failure. Chaos testing arbitrarily shuts down different parts of the system to validate that fallback procedures function correctly.

Cloud-Native Performance Testing

When testing cloud-native applications, several additional considerations come into play:

Container Performance Testing

Monitor container-specific metrics:

# Example Kubernetes metrics using Prometheus queries
# Container CPU Usage
sum(rate(container_cpu_usage_seconds_total{container!=""}[5m])) by (container)

# Container Memory Usage
sum(container_memory_usage_bytes{container!=""}) by (container)

# Container Network I/O
sum(rate(container_network_receive_bytes_total[5m])) by (pod)
sum(rate(container_network_transmit_bytes_total[5m])) by (pod)

Kubernetes-Based Load Testing

Example using k6 in a Kubernetes cluster:

# k6-load-test.yaml
apiVersion: k6.io/v1alpha1
kind: K6
metadata:
  name: k6-sample
spec:
  parallelism: 3
  script:
    configMap:
      name: k6-test-script
      file: test.js
  runner:
    image: loadimpact/k6:latest
    env:
      - name: K6_OUT
        value: influxdb=http://influxdb:8086/k6

Cloud Provider Load Testing Services

Examples for different cloud providers:

Azure Load Testing:

# azure-load-test.yaml
resources:
  - name: load-test
    type: Microsoft.LoadTestService/loadTests
    properties:
      description: "Production load test"
      loadTestConfig:
        engineInstances: 1
        testPlan: "loadtest.jmx"
      secrets:
        - name: "endpoint"
          value: "https://api.example.com"

AWS CloudWatch Synthetics:

// canary.js
const synthetics = require('Synthetics');
const log = require('SyntheticsLogger');

const apiCanaryBlueprint = async function () {
    const url = 'https://api.example.com/health';
    const response = await synthetics.executeHttpStep(
        'Verify API Health',
        url,
        {
            includeResponseHeaders: true,
            includeRequestHeaders: true
        }
    );
    
    const responseCode = response.statusCode;
    if (responseCode !== 200) {
        throw `Failed with response code: ${responseCode}`;
    }
};

exports.handler = async () => {
    return await apiCanaryBlueprint();
};

Modern Performance Testing Tools

Load Testing Tools

Tool
Best For
Cloud Integration

k6

Modern cloud-native applications

Grafana Cloud, any Kubernetes

Apache JMeter

Enterprise applications

Azure Load Testing, AWS Marketplace

Artillery

Microservices

AWS Lambda, Azure Functions

Gatling

Scala/Java applications

Jenkins, AWS CodeBuild

Locust

Python-based systems

Google Cloud Load Testing

Example k6 Script for Modern Applications:

// performance-test.js
import http from 'k6/http';
import { check, sleep } from 'k6';
import { Rate } from 'k6/metrics';

const errorRate = new Rate('errors');

export const options = {
  stages: [
    { duration: '5m', target: 100 },  // Ramp up
    { duration: '10m', target: 100 }, // Stay at peak
    { duration: '5m', target: 0 },    // Ramp down
  ],
  thresholds: {
    http_req_duration: ['p(95)<500'], // 95% requests must complete below 500ms
    errors: ['rate<0.1'],             // Error rate must be less than 10%
  },
};

export default function () {
  const response = http.get('https://api.example.com/users');
  
  check(response, {
    'is status 200': (r) => r.status === 200,
    'response time < 500ms': (r) => r.timings.duration < 500,
  });
  
  errorRate.add(response.status !== 200);
  sleep(1);
}

Cloud-Native Monitoring Integration

Add examples of integrating performance testing with cloud monitoring:

# prometheus-servicemonitor.yaml
apiVersion: monitoring.coreos.com/v1
kind: ServiceMonitor
metadata:
  name: app-monitor
spec:
  selector:
    matchLabels:
      app: your-app
  endpoints:
  - port: metrics
    interval: 15s
    path: /metrics
# grafana-dashboard.yaml
apiVersion: integreatly.org/v1alpha1
kind: GrafanaDashboard
metadata:
  name: performance-dashboard
spec:
  json: |
    {
      "title": "Application Performance",
      "panels": [
        {
          "title": "Response Time",
          "type": "graph",
          "datasource": "Prometheus",
          "targets": [
            {
              "expr": "histogram_quantile(0.95, sum(rate(http_request_duration_seconds_bucket[5m])) by (le))",
              "legendFormat": "P95 Response Time"
            }
          ]
        }
      ]
    }

Automated Performance Testing in CI/CD

Add example of GitHub Actions workflow for automated performance testing:

# .github/workflows/performance-test.yml
name: Performance Testing

on:
  push:
    branches: [ main ]
  pull_request:
    branches: [ main ]

jobs:
  performance:
    runs-on: ubuntu-latest
    steps:
      - uses: actions/checkout@v3
      
      - name: Install k6
        run: |
          sudo apt-key adv --keyserver hkp://keyserver.ubuntu.com:80 --recv-keys C5AD17C747E3415A3642D57D77C6C491D6AC1D69
          echo "deb https://dl.k6.io/deb stable main" | sudo tee /etc/apt/sources.list.d/k6.list
          sudo apt-get update
          sudo apt-get install k6
      
      - name: Run Performance Tests
        run: k6 run tests/performance/load-test.js
      
      - name: Archive test results
        uses: actions/upload-artifact@v3
        with:
          name: performance-test-results
          path: k6-summary.json

Performance monitor metrics

When executing the various types of testing approaches, whether it is stress, endurance, spike, or chaos testing, it is important to capture various metrics to see how the system performs.

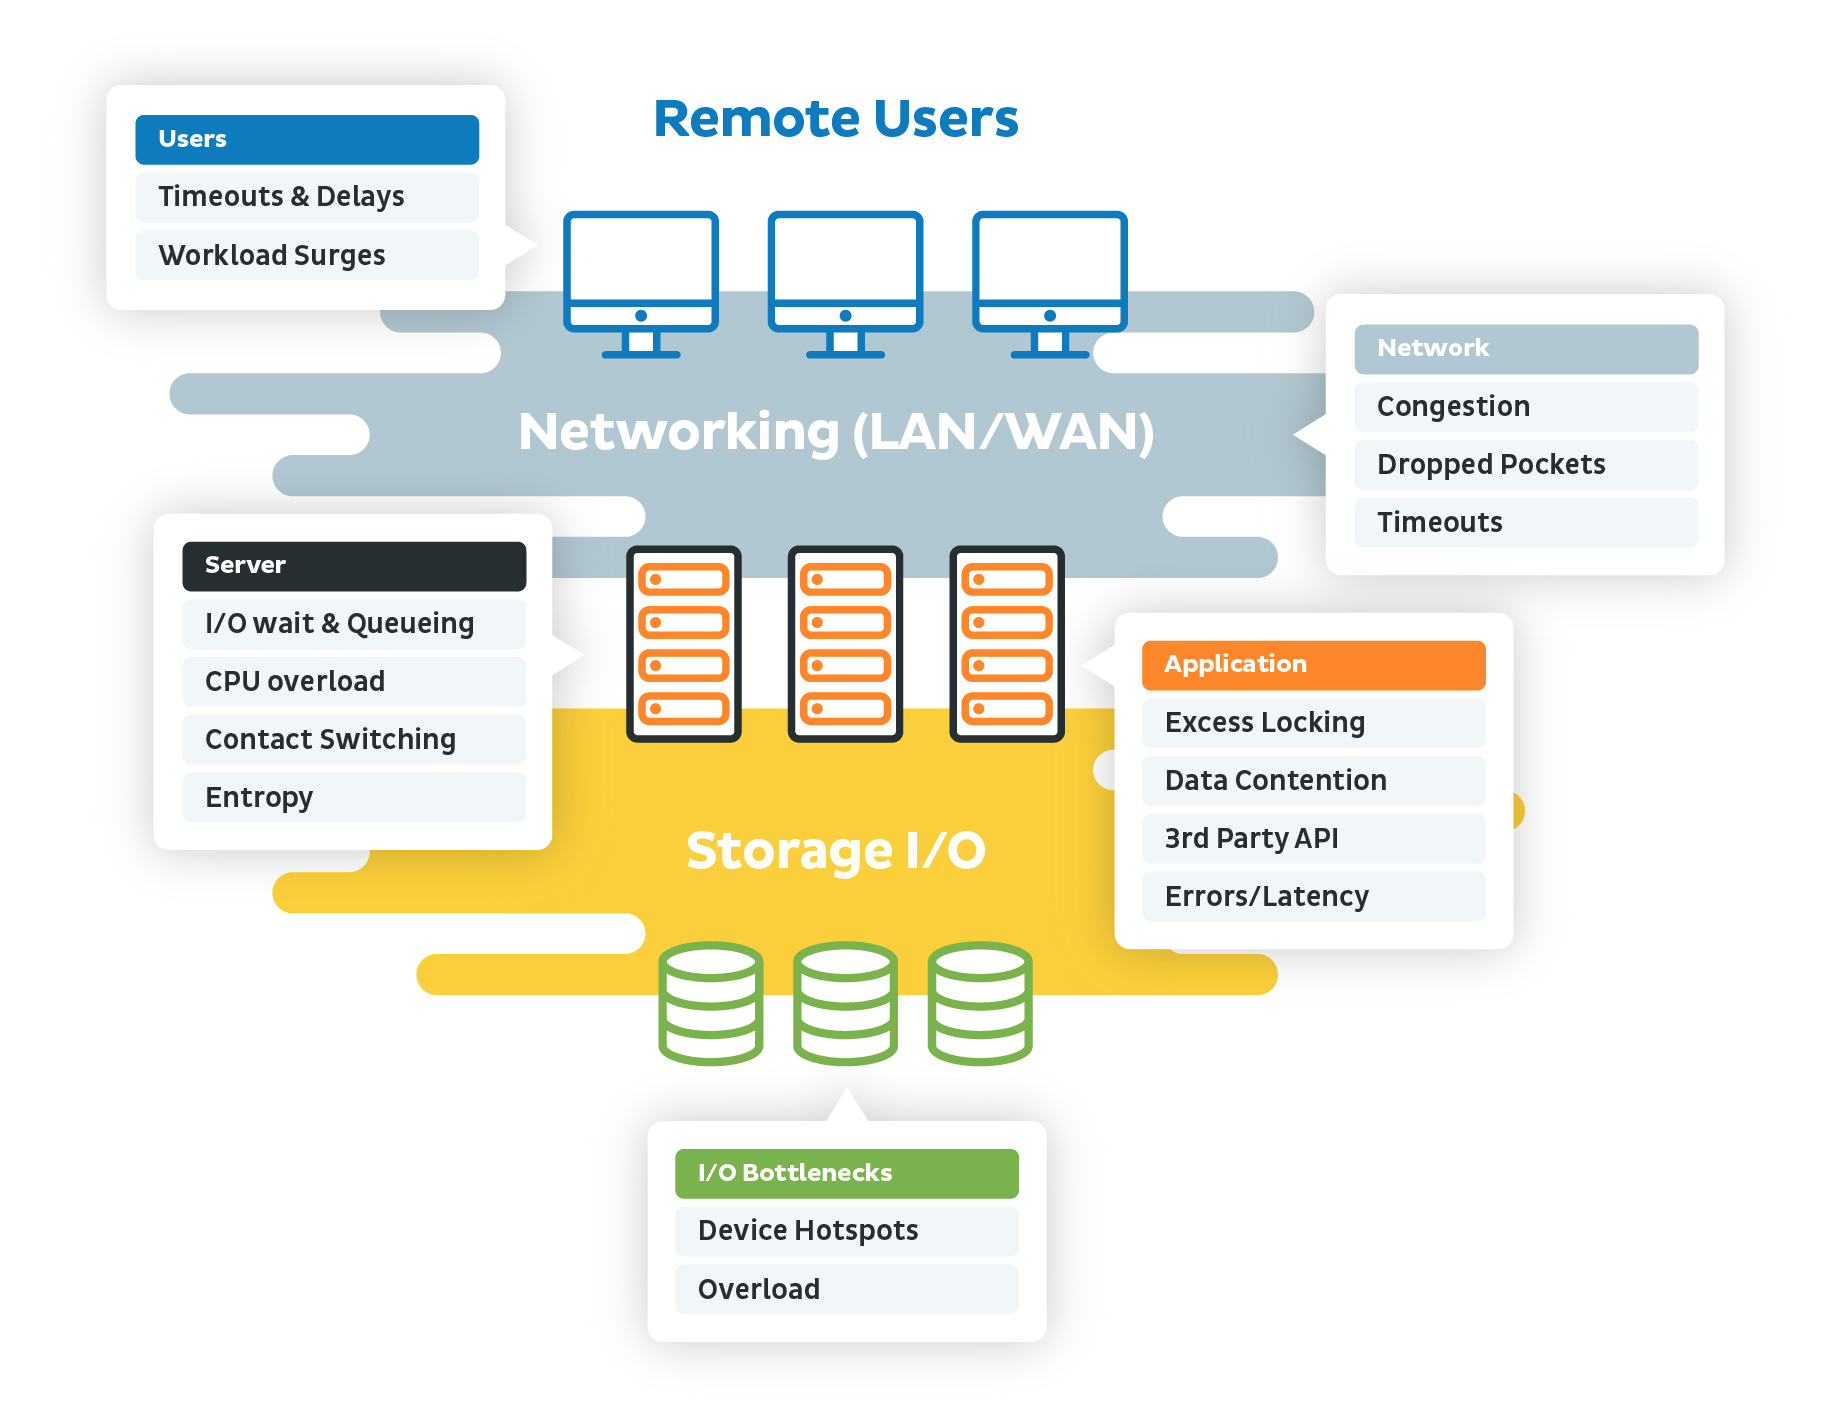
At the basic hardware level, there are four areas to consider.

  • Physical disk

  • Memory

  • Processor

  • Network

These four areas are inextricably linked, meaning that poor performance in one area will lead to poor performance in another area. Engineers concerned with understanding application performance, should focus on these four core areas.

The classic example of how performance in one area can affect performance in another area is memory pressure.

If an application's available memory is running low, the operating system will try to compensate for shortages in memory by transferring pages of data from memory to disk, thus freeing up memory. But this work requires help from the CPU and the physical disk.

This means that when you look at performance when there are low amounts of memory, you will also notice spikes in disk activity as well as CPU.

Physical Disk

Almost all software systems are dependent on the performance of the physical disk. This is especially true for the performance of databases. More modern approaches to using SSDs for physical disk storage can dramatically improve the performance of applications. Here are some of the metrics that you can capture and analyze:

Counter
Description

Avg. Disk Queue Length

This value is derived using the (Disk Transfers/sec)*(Disk sec/Transfer) counters. This metric describes the disk queue over time, smoothing out any quick spikes. Having any physical disk with an average queue length over 2 for prolonged periods of time can be an indication that your disk is a bottleneck.

% Idle Time

This is a measure of the percentage of time that the disk was idle. ie. there are no pending disk requests from the operating system waiting to be completed. A low number here is a positive sign that disk has excess capacity to service or write requests from the operating system.

Avg. Disk sec/Read and Avg. Disk sec/Write

These both measure the latency of your disks. Latency is defined as the average time it takes for a disk transfer to complete. You obviously want is low numbers as possible but need to be careful to account for inherent speed differences between SSD and traditional spinning disks. For this counter is important to define a baseline after the hardware is installed. Then use this value going forward to determine if you are experiencing any latency issues related to the hardware.

Disk Reads/sec and Disk Writes/sec

These counters each measure the total number of IO requests completed per second. Similar to the latency counters, good and bad values for these counters depend on your disk hardware but values higher than your initial baseline don't normally point to a hardware issue in this case. This counter can be useful to identify spikes in disk I/O.

Processor

It is important to understand the amount of time spent in kernel or privileged mode. In general, if code is spending too much time executing operating system calls, that could be an area of concern because it will not allow you to run your user mode applications, such as your databases, Web servers/services, etc.

The guideline is that the CPU should only spend about 20% of the total processor time running in kernel mode.

Counter
Description

% Processor time

This is the percentage of total elapsed time that the processor was busy executing. This counter can either be too high or too low. If your processor time is consistently below 40%, then there is a question as to whether you have over provisioned your CPU. 70% is generally considered a good target number and if you start going higher than 70%, you may want to explore why there is high CPU pressure.

% Privileged (Kernel Mode) time

This measures the percentage of elapsed time the processor spent executing in kernel mode. Since this counter takes into account only kernel operations a high percentage of privileged time (greater than 25%) may indicate driver or hardware issue that should be investigated.

% User time

The percentage of elapsed time the processor spent executing in user mode (your application code). A good guideline is to be consistently below 65% as you want to have some buffer for both the kernel operations mentioned above as well as any other bursts of CPU required by other applications.

Queue Length

This is the number of threads that are ready to execute but waiting for a core to become available. On single core machines a sustained value greater than 2-3 can mean that you have some CPU pressure. Similarly, for a multicore machine divide the queue length by the number of cores and if that is continuously greater than 2-3 there might be CPU pressure.

Network Adapter

Network speed is often a hidden culprit of poor performance. Finding the root cause to poor network performance is often difficult. The source of issues can originate from bandwidth hogs such as videoconferencing, transaction data, network backups, recreational videos.

In fact, the three most common reasons for a network slow down are:

  • Congestion

  • Data corruption

  • Collisions

Some of the tools that can help include:

  • ifconfig

  • netstat

  • iperf

  • tcpretrans

  • tcpdump

  • WireShark

Troubleshooting network performance usually begins with checking the hardware. Typical things to explore is whether there are any loose wires or checking that all routers are powered up. It is not always possible to do so, but sometimes a simple case of power recycling of the modem or router can solve many problems.

Network specialists often perform the following sequence of troubleshooting steps:

  • Check the hardware

  • Use IP config

  • Use ping and tracert

  • Perform DNS Check

More advanced approaches often involve looking at some of the networking performance counters, as explained below.

Network Counters

The table above gives you some reference points to better understand what you can expect out of your network. Here are some counters that can help you understand where the bottlenecks might exist:

Counter
Description

Bytes Received/sec

The rate at which bytes are received over each network adapter.

Bytes Sent/sec

The rate at which bytes are sent over each network adapter.

Bytes Total/sec

The number of bytes sent and received over the network.

Segments Received/sec

The rate at which segments are received for the protocol

Segments Sent/sec

The rate at which segments are sent.

% Interrupt Time

The percentage of time the processor spends receiving and servicing hardware interrupts. This value is an indirect indicator of the activity of devices that generate interrupts, such as network adapters.

There is an important distinction between latency and throughput. Latency measures the time it takes for a packet to be transferred across the network, either in terms of a one-way transmission or a round-trip transmission. Throughput is different and attempts to measure the quantity of data being sent and received within a unit of time.

Memory

Counter
Description

Available MBs

This counter represents the amount of memory that is available to applications that are executing. Low memory can trigger Page Faults, whereby additional pressure is put on the CPU to swap memory to and from the disk. if the amount of available memory dips below 10%, more memory should be obtained.

Pages/sec

This is actually the sum of "Pages Input/sec" and "Pages Output/sec" counters which is the rate at which pages are being read and written as a result of pages faults. Small spikes with this value do not mean there is an issue but sustained values of greater than 50 can mean that system memory is a bottleneck.

Paging File(_Total)\% Usage

The percentage of the system page file that is currently in use. This is not directly related to performance, but you can run into serious application issues if the page file does become completely full and additional memory is still being requested by applications.

Key Performance testing activities

Performance testing activities vary depending on the subcategory of performance testing and the system's requirements and constraints. For specific guidance you can follow the link to the subcategory of performance tests listed above. The following activities might be included depending on the performance test subcategory:

Identify the Acceptance criteria for the tests

This will generally include identifying the goals and constraints for the performance characteristics of the system

Plan and design the tests

In general we need to consider the following points:

  • Defining the load the application should be tested with

  • Establishing the metrics to be collected

  • Establish what tools will be used for the tests

  • Establish the performance test frequency: whether the performance tests be done as a part of the feature development sprints, or only prior to release to a major environment?

Implementation

  • Implement the performance tests according to the designed approach.

  • Instrument the system and ensure that is emitting the needed performance metrics.

Test Execution

  • Execute the tests and collect performance metrics.

Result analysis and re-testing

  • Analyze the results/performance metrics from the tests.

  • Identify needed changes to tweak the system (i.e., code, infrastructure) to better accommodate the test objectives.

  • Then test again. This cycle continues until the test objective is achieved.

🧪
Performance Testing Guidance for Web Applications